cyber
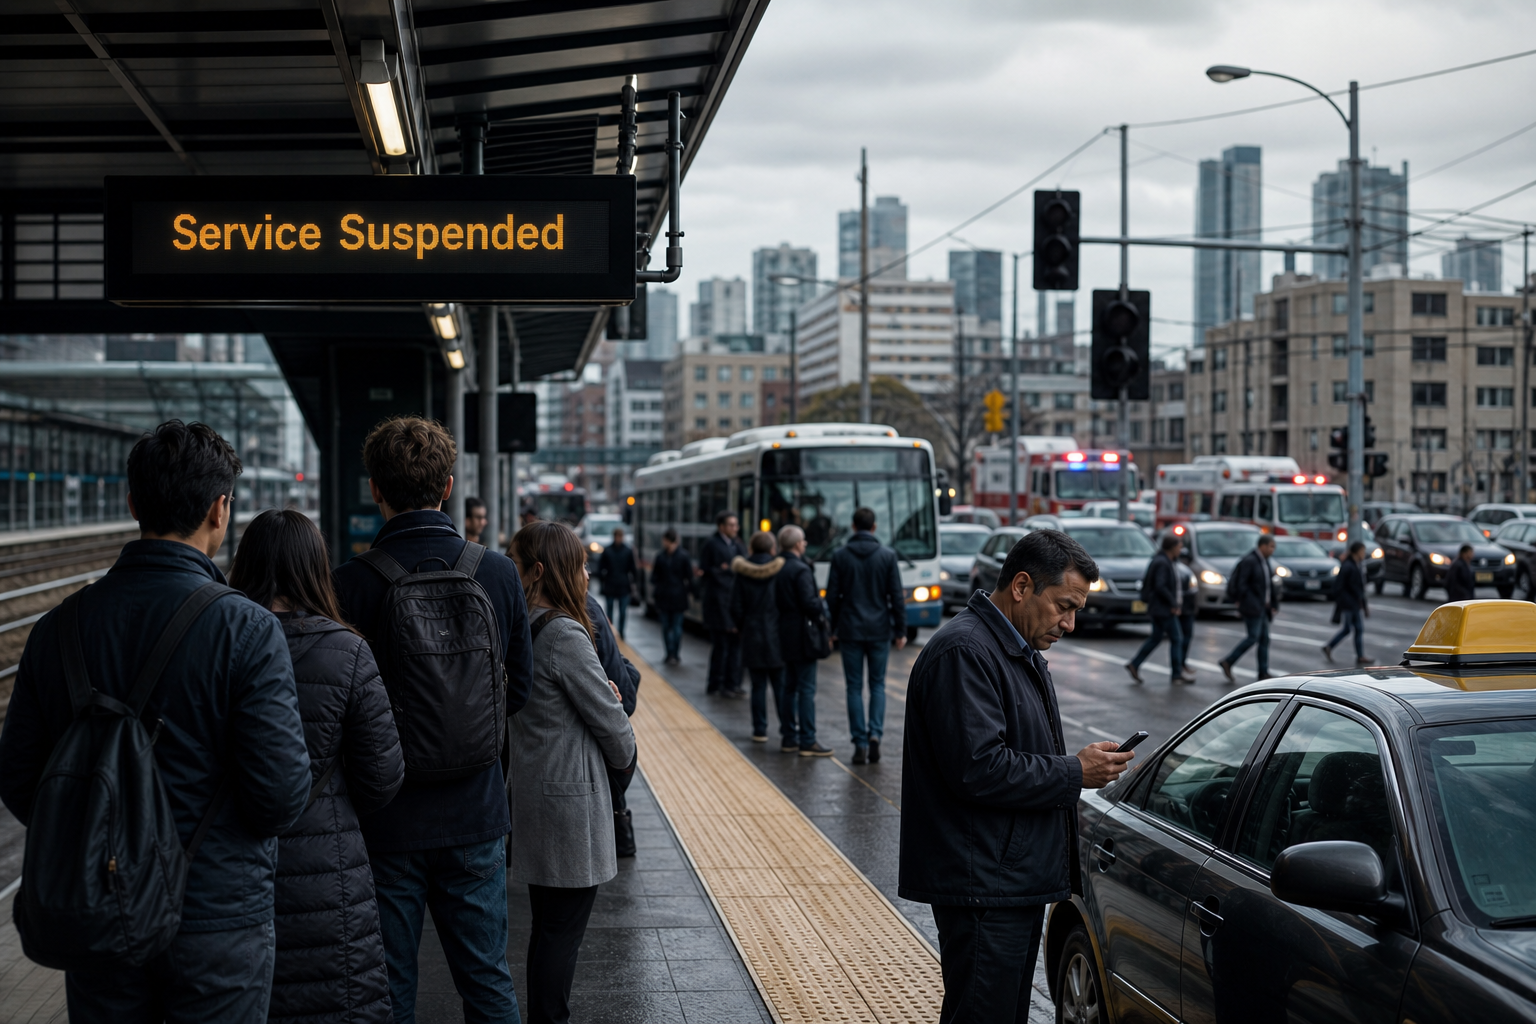

On the morning of Wednesday 8 July 2026, a time-synchronisation fault in Telstra's Sydney and Melbourne data centres rippled out across the country. Victoria's entire V/Line regional rail network was suspended. Some NSW regional and intercity services stopped. Card payments faltered at tills and in taxis. A number of triple-zero calls were affected. A handful of EV chargers and, in Adelaide, hundreds of traffic signals dropped offline.
There was no attacker. The Prime Minister confirmed no evidence of malicious activity, and Telstra described it as an internal technical failure. Roughly 90% of services were restored by 10am, though many customers were affected for around five hours through the morning peak.
Here's the uncomfortable part for anyone who owns a risk register: a single, non-malicious fault in an asset you don't own and can't scan stopped trains, froze payments, and touched emergency calls — all at once. On a traditional colour-coded heatmap, "mobile network dependency" was almost certainly sitting at amber, with a tidy note about a mitigation plan. So what was that risk actually worth, in dollars, when it finally landed?
Before we start: the figures below are an illustrative model built entirely from public data and stated assumptions — not an audit of Telstra's network, and not an official loss figure. CyQuantiFi has no relationship with Telstra. The point isn't the exact number. The point is that a number like this is buildable, defensible, and far more useful to a board than "amber."
Modern trains don't just carry passengers who happen to be on their phones. As telecommunications researcher Faraz Hasan explained in The Conversation, many rail systems use roof-mounted antennae to exchange time-critical signalling and diagnostic data with control centres over the public mobile network. When the network loses time synchronisation, the safe-operation guarantee that lets a train move is gone. The government-owned Australian Rail Track Corporation, which upgraded its train-to-control communications to 4G in 2024, suspended freight nationally as a precaution.
The same dependency runs under card payments (terminals that fall back to mobile data), taxi meters, EV chargers, and — most seriously — the fallback path for emergency calls. None of these systems failed on their own merits. They failed because they all quietly leaned on the same underlying asset.
In risk terms, that's correlated exposure: several risks that look independent on a register but move together the moment a shared dependency shifts. We call it shared weather. When the weather turns, the losses don't add up politely one by one — they surge together, and the worst-case tail is fatter than any "each risk in its own row" model will ever show you.
The whole regional Victorian network stopped during the morning peak.
National run-rate from RBA data — a slice of it exposed while terminals were down.
Onset ~4.30am; ~90% restored by 10am; worst of it through the commute.
"What did the outage cost?" is the wrong question, because it smuggles three very different numbers into one. A disciplined estimate keeps them apart:
Activity lost across every affected business and traveller. The big, headline-grabbing figure — and the softest.
What it costs Telstra itself — remediation, goodwill credits, compensation provisions.
Fines — conditional on breaches being confirmed, especially around triple-zero.
These overlap and measure different things. You do not add them together. Doing so is the single most common way outage-cost headlines get inflated.
The nearest benchmark is the November 2023 Optus outage: around 10 million people and 400,000 businesses, for roughly 13–14 hours. A peer-reviewed academic analysis put the economy-wide loss at approximately A$2 billion — an estimate, not an audited number, so we treat it as an order-of-magnitude anchor only. Tellingly, Optus's own booked cost (a provision of roughly A$40–61 million) sat two orders of magnitude below that economy-wide figure. Same event, two "costs," 30x apart. That gap is exactly why you separate the buckets.
The Telstra event was shorter (~5 hours vs ~13–14) and had a smaller confirmed mobile footprint — Telstra characterised directly affected users as "thousands" to "tens of thousands," though independent reporting suggested more. So rather than scale the A$2 billion anchor down and call it a day, we build the exposed channels bottom-up and use the anchor as a sanity check.
| Loss channel (economy-wide) | Illustrative range | Key assumption |
|---|---|---|
| Rail — lost passenger time | A$1–2m | ~25k peak travellers × 1–2 hrs × ATAP value-of-time (~A$19–31/hr) |
| Rail — freight delay + coaches/refunds | A$1–5m | National freight paused; replacement coaches historically up to ~A$300k/day |
| Card payments — permanently lost sales | A$2–15m | Slice of ~A$125m/hr exposed, then a heavy deferral haircut (most spend is delayed, not destroyed) |
| Business productivity / lost trade | A$10–120m | Affected workers/traders × hours × earnings, discounted hard for WiFi and other-network workarounds |
| Illustrative economy-wide band | ~A$15m – A$140m | Base case ~A$50–80m. Dominated by the productivity assumption. |
Reconciliation. Duration-scaling the Optus anchor alone (~5 / ~13.5 hours) would imply ~A$740m if the footprint were comparable. Our bottom-up band sits well below that — which is the honest signal that the confirmed footprint was much narrower. But this is the number that moves most: if Telstra later confirms millions of affected services rather than thousands, the estimate climbs sharply toward that top-down figure. That's not a flaw in the model; it's the model telling you precisely which fact to go and pin down.
The other two buckets, kept separate: an operator cost in the low tens of millions (remediation plus any goodwill credits — Telstra gave affected customers a free data day after an outage in 2016), and a regulatory penalty that, if triple-zero breaches are confirmed, has a clear precedent band — ACMA fined Optus A$12 million for its 2023 triple-zero failures, and fined Telstra just over A$3 million for a 2024 emergency-call disruption.
Where "amber" hides the real money. A heatmap treats rail, payments and emergency calls as three separate amber cells. But they share one dependency, so they fail together — and the combined tail is far heavier than three independent risks would suggest. A dollar model forces that correlation into the open. That's the difference between a colour and a number you can budget against.
Here's what makes this a genuinely hard problem, and where most cyber tooling gives up. The rail operator's biggest exposure that morning lived inside Telstra's network — an asset it doesn't own, can't instrument, and can't run a vulnerability scanner across. Every scanning-based risk tool is blind to it, because there's nothing on your side of the fence to scan.
These are the assets we built CyQuantiFi to quantify: third-party and supplier dependencies, OT and SCADA, legacy and air-gapped systems — the ones with the highest consequence and the least automated data. Because you can't scan them, the only honest way to estimate their risk is structured expert consensus: put the right people's judgement into a disciplined, calibration-tracked process, and turn disagreement into a defensible probability instead of a gut-feel colour. That estimate feeds the same FAIR-based simulation as everything else, and comes out the other side as an Annual Loss Expectancy in dollars — a range, with confidence intervals, that a board can actually act on.
And note what didn't matter to any of this: the outage wasn't an attack. A configuration fault and a ransomware crew produce the same loss model — trains stop, payments freeze, the tail gets fatter. CyQuantiFi doesn't prevent the outage. It tells you, in advance and in dollars, what a morning like this is worth — so resilience gets funded before the fault, not after the apology.
List the single suppliers — telco, DNS, identity, payments — that more than one "independent" risk quietly leans on. Those are your correlation points.
Not a colour — a low/base/high band with the assumptions written down. If you can't build it, that's a tooling gap, not a data gap.
Ask what happens when the shared dependency fails and several risks fire at once. The honest worst case is fatter than the sum of the parts.
Third-party, OT and legacy exposure won't show up in a scanner. Use structured expert consensus to give them a defensible number anyway.
Supply-chain and "all-hazards" dependencies are squarely in scope. A dollar-based estimate is the cleanest evidence you can put in front of a board and a regulator.
The 8 July outage cost Australia somewhere in the tens to low hundreds of millions of dollars in lost activity — plausibly A$50–80 million in our base case, with a wide, honestly-stated band around it and one dominant swing factor still unconfirmed. Add a separate operator cost in the tens of millions, and a conditional regulatory penalty with a A$3–12 million precedent. None of that is precise. All of it is more decision-useful than "amber."
The reason boards get blindsided by mornings like this isn't that the risk was unknown. It's that it was recorded as a colour, in a cell, next to two other colours that turned out to be the same risk wearing different hats. Dollars force the connections into daylight. Correlation stops being invisible. And the assets you can't scan — the ones that actually stopped the trains — finally get a number.
You don't need an outage to run this analysis. You need it done before the next one. Math over vibes.
See how CyQuantiFi puts a defensible dollar figure on the risks your scanners can't reach.
The dollar figures in this article are an illustrative model built from public data and clearly stated assumptions for educational purposes. They are not an audit of any organisation's network and do not represent official loss figures. CyQuantiFi has no commercial relationship with Telstra.